Today, the United States Census Bureau released its official measures of the financial wellbeing of Americans in 2017, the first year of the Trump Administration. The news is good. Median household income increased by 1.8 percent, reaching $61,372. The official poverty rate fell by 0.4 percentage points to 12.3 percent, and more than 900,000 fewer people were living in poverty in 2017 than in 2016.
The effects of the strong economy are reaching Americans throughout the United States. Income gains were apparent in every region of the country and among both high- and low-income households. Among Hispanics, incomes rose by 3.7 percentage points and surpassed $50,000 for the first time on record. Additionally, the official poverty rates of both blacks and Hispanics fell in 2018, each reaching new series lows.
These improvements reflect the recent strength of the economy and the job market. The Census data indicate that there were 1.7 million more people working in 2017 relative to 2016; and 2.4 million more people who were working full-time, year-round. That means not only are more Americans entering the workforce, but more are shifting from part-time to full-time work.
The strength of the labor market is a key component of both rising incomes and reductions in poverty. Among the increasing share of working-age adults who are working full-time year-round, the official poverty rate is just 2.2 percent, suggesting that work is an important pathway out of poverty.
These reductions in poverty are also consistent with a recently released report from the U.S. Department of Agriculture finding that food insecurity fell from 12.3 to 11.8 percent between 2016 and 2017. Over the same period of time, the mean monthly food stamp caseload fell by 1.7 million people, suggesting that growing employment and the earnings that come with it is a more reliable way to reduce food insecurity than expanding welfare programs.
While improvements in these official societal success indicators are welcome news, they nonetheless understate economic progress. Median household income is a pre-tax, post-cash transfer measure of income. It measures income before income and payroll taxes are deducted (and tax credits added) and after cash transfers (e.g., Social Security, cash welfare, etc.) are added. It excludes non-cash welfare benefits (e.g., food stamps, Medicaid, and housing assistance). As we showed in Figure 3.5 of the 2018 Economic Report of the President this measure, especially since 2000, has understated the level and growth of median income over time compared to a fuller measure of median income that reports income after all Federal Government taxes and transfers are considered.
The same is true with respect to poverty. Although the 0.4 percentage point decline in the official poverty rate indicates improved conditions for low-income Americans, the official poverty measure is a flawed approach to measuring absolute material hardship. It excludes non-cash welfare benefits (e.g., Medicaid, food stamps, and housing assistance) as well as refundable tax credits such as the Earned Income Tax Credit and the Child Tax Credit from income. These are real resources that affect economic wellbeing and they should be accounted for in economic hardship measures. Additionally, while designed as an absolute hardship measure as opposed to a relative measure, the official poverty thresholds also overstate inflation (by using the CPI-U instead of preferred measures like the PCE). Hence it understates progress in reducing absolute material hardship over time.
In response to these well-recognized flaws with the official poverty measure, the Census Bureau has reported a supplemental poverty rate for each year since 2009. While the supplemental poverty measure is an improvement over the official measure, it also is a flawed measure of absolute material hardship. While it includes most in-kind welfare benefits, it excludes the value of health insurance. In addition, it is a quasi-relative measure of poverty since its thresholds increase each year based on expenditures by moderate-income households. Hence, it should not be mistaken for measuring changes in absolute material hardship.
An absolute consumption-based poverty measure addresses many of the flaws of the official and supplemental poverty measures. A consumption measure focuses on what households spend rather than their income, better reflecting the resources they use to meet their material needs. The figure below shows the poverty rate based on an absolute consumption poverty measure developed by Bruce Meyer and James Sullivan (Meyer and Sullivan 2012; 2017). While the consumption-based poverty threshold is arbitrary (as is the threshold for income-based poverty), the dramatic reduction in absolute consumption poverty stands in stark contrast to the relatively constant trends in the official poverty rate and the supplemental poverty rate (estimated by the Census Bureau since 2009 and extended historically by Fox et al. 2015).
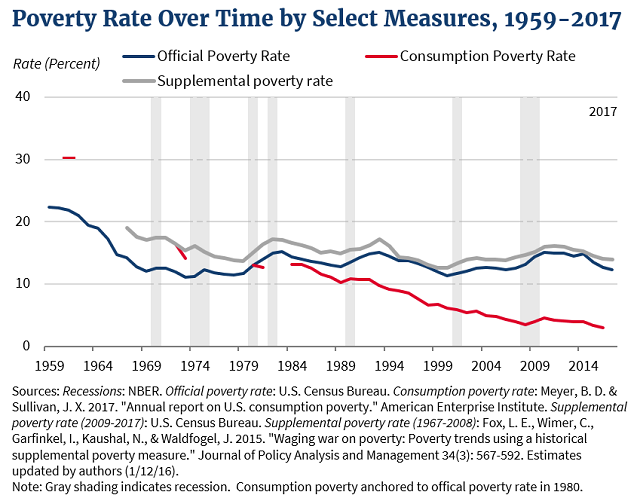
Between 1972 and 2017, the official poverty rate rose from 11.9 to 12.3, and the supplemental poverty rate fell from 16.4 to 13.9 percent. By contrast, between 1972 and 2016 consumption-based poverty (anchored to the official poverty rate in 1980) fell from 16.4 to 3.0 percent. Going back even further, the consumption based poverty measure fell from 30.2 percent in 1961, which amounts to a 90 percent reduction over these 55 years. When measured properly, poverty has fallen dramatically since Lyndon B. Johnson first declared a War on Poverty in 1964.
While absolute material hardship has declined, less success has been achieved in strengthening self-sufficiency. Employment rates of non-disabled working-age adults have been stunted, and their dependency on welfare programs has grown. It is important to ensure that welfare programs do a better job of promoting work, especially in today’s hot economy. Expanding work requirements in welfare programs can help achieve that goal.
Today’s official Census numbers are yet another indicator of how the growing economy has benefited Americans across the income distribution. But the news is actually better than these numbers suggest, and we should seek to continue these advancements into the future. To sustain our progress in improving living standards through work and self-sufficiency, it is important to ensure that our welfare programs and economic policies are aligned toward work and that our measures of success are able to fully capture that progress.
