In 2018 (2017:Q4 to 2018:Q4), the U.S. economy grew at a rapid rate of 3.1 percent, the fastest pace for any calendar year since 2005, with output rising by $560 billion over the four quarters of the year. For the second consecutive year, economic growth precisely matched or narrowly exceeded the Administration’s own forecast, outperforming consensus forecasts in the process. Gross private domestic investment, just 17 percent of GDP at the start of the year, accounted for 36 percent of the growth in real GDP in 2018. Real investment in intellectual property products, up 10.8 percent, and grew at its fastest pace since 1999.
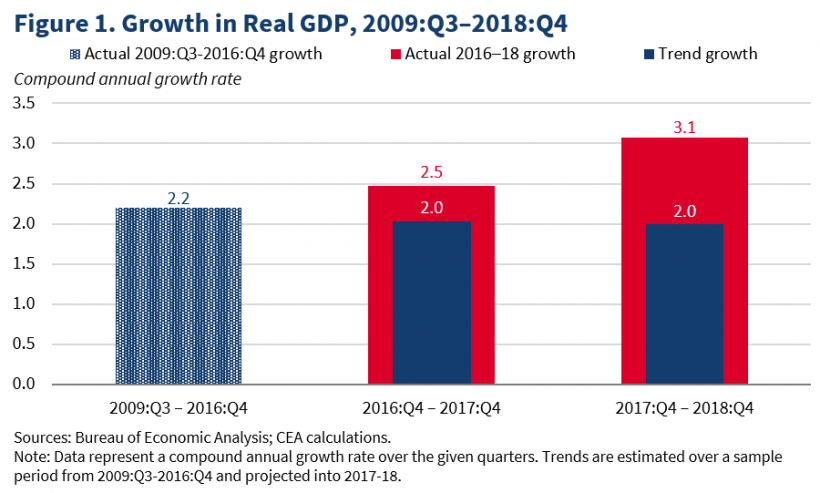
This impressive economic performance was not merely a continuation of trends already underway during the preceding expansion, but rather a marked acceleration of economic activity. Figure 1 reports that during the entire post-recession expansion from 2009:Q3 through 2016:Q4, the U.S. economy grew at a compound annual rate of just 2.2 percent. Estimating a time trend in the growth rate of real GDP over the 2009:Q3-2016:Q4 period, projecting that trend into 2017-18, and reconstructing levels from projected growth rates suggests that had the pre-2017 trend continued, growth would have been 2.0 percent in 2017 and 2018. Overall, U.S. economic output in 2018 was instead $280 billion larger than if the pre-2017 trend had continued. The 1.1 percentage point performance above trend is almost exactly in line with peer-reviewed estimates of an exogenous tax shock of the same magnitude as the Tax Cuts and Jobs Act, as reported in Mertens (2018), and is consistent with the Administration’s own estimates of the effects of the law.
The Administration’s official FY2018 forecast, finalized in November 2017, was for 2018 calendar year growth of 3.1 percent, compared to the consensus Blue Chip forecast of 2.3 percent, which was made in the same time period (November 2017). Even following passage of the Tax Cuts and Jobs Act, the January 2018 consensus forecast for 2018 growth was only 2.6 percent. Achieving 3.1 percent growth in 2018 therefore marks the second consecutive year that the U.S. economy has exceeded consensus forecasts. As reported in Figure 2, 2018 also marks the second consecutive year in which the U.S. economy has exactly matched or narrowly exceeded the Administration’s own growth forecasts, in contrast to the consistent overestimation of growth by the preceding Administration.
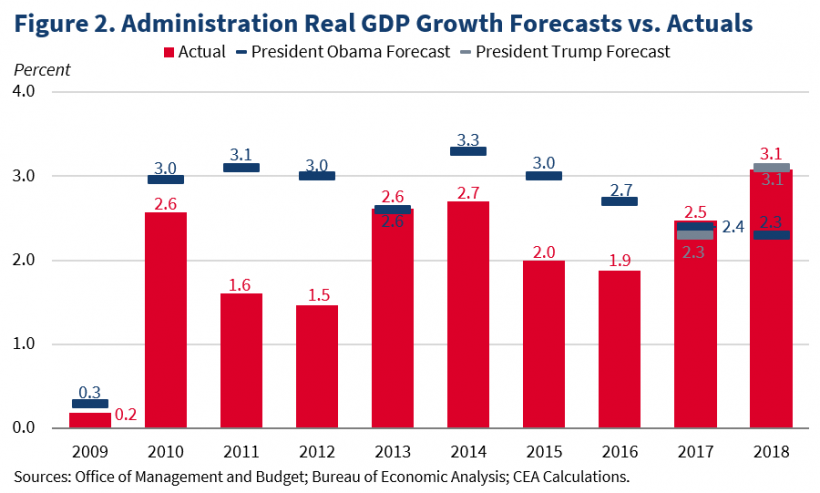
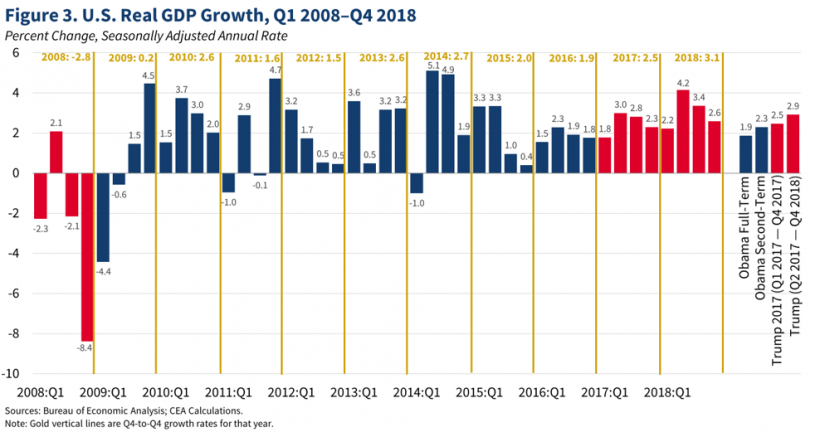
Figure 3 reports seasonally adjusted annual growth rates in real GDP by quarter over the current business cycle. Following considerable volatility during the pre-2017 expansion, and after slowing in 2015 and 2016, real GDP growth since 2016:Q4 has been consistently strong. Over the 7 full quarters of the Trump Administration, real output has grown at a compound annual rate of 2.9 percent, compared to a compound annual growth rate of 2.3 percent during the preceding 4-year Presidential term.
Technical note
Annual GDP growth rates are commonly reported in two ways: 1) from annual average (i.e., an average across all four quarters in a given year) to annual average and 2) from fourth quarter to fourth quarter. The two concepts provide somewhat different information. The annual-average-to-annual-average growth rates reflect what happened in the preceding year as well as what happened during the year in question. In contrast, the fourth-quarter-to-fourth-quarter growth rates reflect only what happened during the specified year, and can be approximated by averaging the growth rates of the four quarters of the year. Seven quarterly growth rates are needed to approximate the annual-average to annual-average growth rates, and three of those quarters (with a cumulative weight of 6/16) are in the preceding year.
Though there are merits to both approaches, the CEA generally prefers the fourth-quarter-to-fourth-quarter-growth rates (also known as Q4-to-Q4 growth rates), because they reflect only what happens in a given year, and CEA thinks that they are closer to what is meant intuitively in discussions of growth during a certain year. In contrast, annual-average-to-annual-average growth rates are affected by real GDP growth in the final three quarters of the preceding year, and as an artifact of the arithmetic, some quarters are weighted more heavily than others.
To avoid ambiguity and ensure clarity on which measure is being used, we recommend the following language to report fourth-quarter-to-fourth-quarter growth rates:
- Real GDP grew at a 3.1 percent over the four quarters of 2018.
- Real GDP grew 3.1 percent from the fourth quarter of 2017 to the fourth quarter of 2018.
- The fourth-quarter-to-fourth-quarter growth rate in 2018 was 3.1 percent.
For reporting annual-average-to-annual-average growth rates, we would recommend:
- On a year-over-year basis, real GDP grew 2.9 percent.
- The year-to-year growth rate was 2.9 percent.
