The Bureau of Labor Statistics (BLS) released its first monthly Employment Situation Report of 2019, showing that the United States economy is continuing its historic streak of positive job gains in the new year.
Total nonfarm payroll employment rose by 304,000 jobs in January, far surpassing market expectations (165,000) and above the prior 12-month average gain (223,000). January 2019 marks the 100th straight month of positive job growth and the 16th consecutive month of employment growth of at least 100,000 new jobs. Job gains in December were revised down by 90,000 and November jobs were revised up by 20,000 for a cumulative loss to total employment of 70,000 jobs in the previous months. Nevertheless, despite these downward revisions, the 223,000 average monthly jobs created in 2018 remains well above the pace of monthly job creation in 2016 (193,000) and 2017 (179,000).
Numerous sectors experienced job growth in January, including mining and logging (7,000), transportation and warehousing (27,000), construction (52,000), education and health services (55,000), and leisure and hospitality (74,000). The economy has added 4.9 million jobs since January 2017 and 5.3 million jobs since President Donald J. Trump was elected in November 2016.
The report also indicates that wages are continuing to rise. Nominal average hourly earnings rose by 3.2 percent over the past 12 months, marking the 6th straight month that year-over-year wage gains were at or above 3 percent. Prior to 2018, nominal average hourly wage gains had not reached 3 percent since April 2009. Taking inflation into account, real wages are also growing. Based on the most recent Personal Consumption Expenditures (PCE) price index data from November, inflation in the past year was 1.8 percent, and based on the most recent Consumer Price Index (CPI-U) price data from December, the inflation in the past year was 1.9 percent (the most recently available data).
A separate household survey released by BLS shows that the unemployment rate ticked up by 0.1 percentage point (p.p.) to 4.0 percent in January—but still represents the 11th consecutive month at or below 4 percent. Additionally, the labor force participation rate for prime-age adults (ages 25-54) increased by 0.3 percentage points to 82.6 percent. The last time it was this high was April 2010. Though the unemployment rate edged up, this is largely explained by the 2018-19 partial government shutdown and would otherwise have likely remained unchanged.
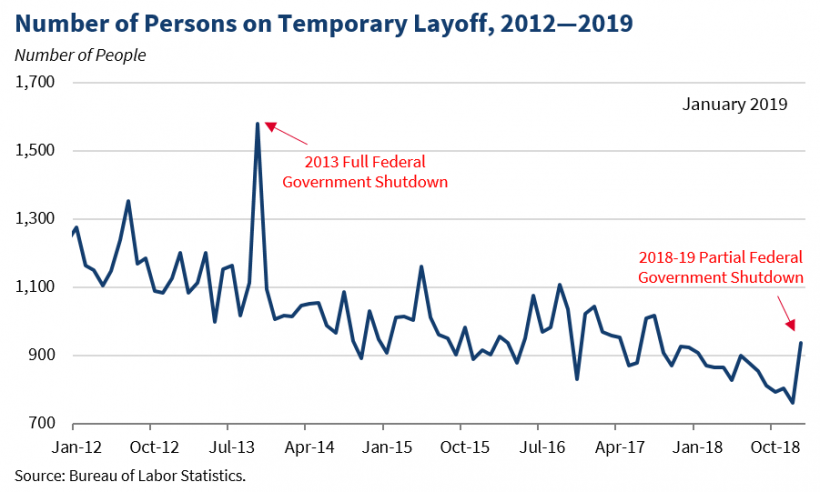
While furloughed Federal workers are included in BLS’s establishment survey (they were scheduled to receive back pay and therefore counted in the monthly job number), they were not considered to be employed in the household survey. Furloughed Federal employees who did not work during the household survey’s reference period (January 6-12, 2019) were categorized as being on temporary layoff, a special unemployed category in which individuals are not necessarily looking for a job because they are expecting to return to work. In January, 104,000 Federal workers—an increase of 91,000 Federal workers (not seasonally adjusted)—were counted as being on temporary layoff, contributing to a spike in the overall number of temporarily unemployed individuals (see figure). CEA estimates that had workers not been furloughed the unemployment rate for January would have remained steady over the month at 3.9 percent.

The January employment data depict a strong American economy. With a continued low unemployment rate, historic trends in job gains, and rising wages, this employment report provides further evidence that the Administration’s pro-growth, pro-worker policies are working.
