A new Department of Labor release shows that 3.2 million individuals filed initial unemployment insurance (UI) claims during the week ending on May 2. Over the past 7 weeks, 33.5 million UI claims were filed, representing 20.3 percent of the 165 million employed and self-employed workers reported in February 2020. Recent UI claims and private-sector data offer some indication of what the Bureau of Labor Statistics’ (BLS) April Employment Situation report will show when it is released on May 8.
The March report’s household survey covered March 8 to March 14, so the report offered only an early indicator of COVID-related employment effects. The April report’s household survey covers April 12 to April 18, so it will show much greater employment effects from actions taken to slow COVID-19’s spread. Indeed, 26.5 million UI claims were filed from the end of the March report’s reference period to the end of the April report’s reference period. The substantial flow of UI claims between the March and April reference periods, compared to pre-COVID trends, suggests that April’s U-3 unemployment rate could rise from 4.4 percent to 19.8 percent.
While the April U-3 unemployment rate is likely to receive the most attention, there are many reasons that the current economic shock makes this measure of the labor market’s health less informative. People who lost their jobs and are not looking for work do not count as in the labor force unless they are temporarily furloughed; instead they count as not in the labor force. This situation is likely common given the combination of States waiving UI work search requirements and weaker hiring demand, as data from job posting websites including Glassdoor and Indeed indicate that hiring has slowed down substantially. Since the U-3 unemployment rate is calculated by the number of the unemployed divided by size of the labor force, the prevalence of this category of workers substantially changes the unemployment rate calculation. BLS has many detailed categories to capture this unprecedented labor market situation, including those who are not in the labor force but are interested in working when labor market conditions improve, but these measure are not reflected in the U-3 unemployment rate.
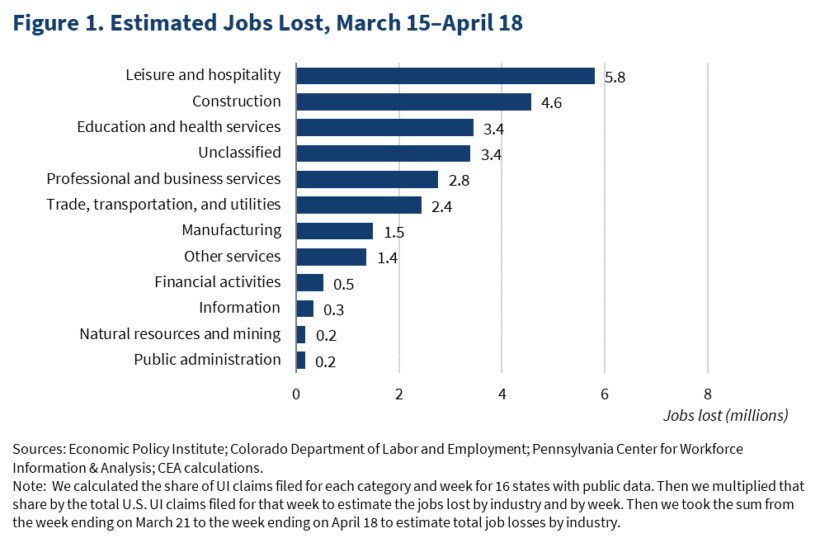
Compared to the unemployment rate, job losses show a clearer picture of lost economic capacity from COVID-19 (though it should be noted that the success of the Paycheck Protection Program likely leads to workers counting as employed and receiving a paycheck even when they are not working). To estimate which industries experienced the most layoffs between the March and April reports, CEA analyzed UI claims by industry for the 16 states with publicly available data. Though these States may not be representative of the United States and some industries may be over or under represented in the sample, the figure below shows that the leisure and hospitality industry has been hit the hardest, with nearly 5.8 million jobs lost from March 15 to April 18, followed by construction (4.6 million), education and health services (3.4 million), and professional and business services (2.8 million). More than 3 million of the estimated 26.5 million jobs lost were not classified by industry, and some of this lack of reporting was due to the CARES Act extending UI benefits to the self-employed and independent contractors.

Because of the lag in government data, private-sector firms and academics have attempted to more quickly capture labor market data. For example, the payroll processing firm Automatic Data Processing Inc. (ADP) estimates a 20.2 million decrease in private sector employment in April. This estimate is slightly less than the median private forecast, which predicts a 21.5 million decrease in private sector employment.
Looking ahead, with many States reopening their economies, there may be early signs of the economic comeback in the May report. However, given the 7 million UI claims since the April report’s reference period and that the May report’s household survey occurs next week, fuller measures of recovery will likely not be shown until the June report—even if they are already underway.
One crucial indicator to watch for in the April report is the share of job losses from temporary furlough. The March report shows that 43 percent of those no longer counted as employed were permanent job losers, while 57 percent were on temporary furlough, including some people not at work for “other reasons.” Additional indicators to watch in the next several months’ reports include the U-6 rate, which captures involuntary part-time workers as well as discouraged or marginally attached workers who were unemployed prior to the crisis and had to stop searching for work.
As States continue reopening their economies, the strength of the labor market will be determined by the ease with which workers who are furloughed can return to work, along with the ability of businesses to absorb workers who have temporarily exited the labor force. Due to Federal policies like the Paycheck Protection Program, millions of business can access necessary liquidity to keep employees on payroll. Expanded unemployment insurance benefits and eligibility also offer a liquidity bridge across COVID-19’s economic disruption to the economic rebound.
The job losses that will be shown in April’s report are likely to astound many Americans, especially when the U-3 unemployment rate was at a 50-year low of 3.5 percent as recently as February. The unprecedented economic disruption from COVID-19, along with the Federal Government’s strong response to the virus by providing liquidity to workers and businesses, makes it difficult to precisely estimate April’s unemployment rate and decreases its usefulness as a measure of the labor market’s health. But UI claims through the survey’s reference period indicate that April’s unemployment rate will rise to a level not seen in the post-war era.
