When the Affordable Care Act (ACA) was passed in 2010, an employer mandate to provide health insurance was included and originally slated to take effect in 2014. The mandate was intended to preserve the provision of private health insurance to more than 150 million Americans. The consequence of not complying with the employer mandate would be liability for a penalty payment to the Federal Government.
Under the mandate, which applies to businesses with 50 or more full-time equivalent employees (FTE)—generally a business that does not provide affordable minimum value health insurance to at least 95% of its full-time employees and their dependents—would be liable for a penalty if a full-time employee qualified for subsidized coverage on the health insurance exchange. These penalty payments, net of decreased revenue due to lower taxable earnings, were projected by the Congressional Budget Office (CBO) in 2013 to be more than $140 billion from FY 2014 to FY 2023, and, as such, were projected to be a significant source of revenue to pay for the ACA, assuming the penalty payment would begin in 2014. But the implementation of this employer mandate/penalty was delayed until 2015 for all employers, and then again until 2016 for employers with 50 to 99 full-time employees, including FTE employees (approximately 2% of employers). In this blog, we evaluate the economic impact of the mandate as well as provide direct evidence of its effectiveness by comparing the actual revenue collected by the Internal Revenue Service (IRS) to CBO’s estimates of revenue to be collected.
The ACA employer mandate forces many employers to get into the business of providing health insurance or to pay a large per-worker tax that goes to subsidizing insurance purchased through the health insurance exchanges. And it is not just the ACA that embeds this approach; almost all previous attempts to achieve universal health insurance coverage in the United States, ranging from Presidents Nixon, Carter, and Clinton to Senator Ted Kennedy and others, relied on an employer mandate as an essential feature of their proposals.
This approach to achieve universal coverage creates a number of challenges for both firms and workers. If employers instead provide the same dollar amount to all employees and at the same time avoid any payments for health insurance, the shift will add relatively more compensation to lower-paid workers. For example, if the employer were paying $6,000 per year for coverage for the worker alone and shifted that amount to all workers who had single-worker coverage, then a worker with $30,000 cash income before would now have $36,000—a 20% increase—with half of the relative effect (only a 10% increase) on a worker who previously was paid $60,000.
At the time of the ACA’s enactment, employers who had not previously offered health insurance were a predictable group—primarily small- to mid-size firms with 50 to 100 FTEs with a relatively large proportion of part-time workers. There is a good reason for this—they pay more to buy the same insurance coverage than larger employers do. The “price of insurance” is the “load” charged by insurance companies (usually expressed as a percentage of the average benefits paid) to cover the costs of administration and the risk-bearing assumed by the insurer. For a variety of reasons, the loading fee charged by insurance companies for employer-based group insurance systematically declines as the number of “covered lives” increases. The effect is quite large.
Two separate estimates using different data lead to similar results. In one analysis, small groups (under 100 people) face, on average, a loading fee of 34% of the premium charged. Groups of more than 100 people in size, on average, face a loading fee of only 15%, and the effect continues as firms get larger and larger. Firms with more than 10,000 employees face average loading fees of only 4%.[i]
A second analysis estimated the loading fee for individual policies (40 to 100% loading), groups of 2 –20 employees (34% loading fee), groups of 100–500 covered lives (16%), and, separately, more than 10,000 covered lives (4–6%).[ii] These two estimates from very different data sources converge to very similar estimates of the group-size gradient for loading fees: Small groups face a 34% load, medium-size groups face a 16% load, and very large groups face a 4–6% load.[iii]
Therefore, requiring firms with 50 or more full-time employees, including FTE employees, to provide health insurance for at least 95% of their full-time workers systematically burdens smaller firms more than larger firms. For example, the costs of providing a plan that provides the minimum actuarial value of 60% (the minimum coverage allowed to meet the ACA employer mandate) will be about one-third more per worker for small firms (less than 100 workers) than for the largest firms (more than 10,000 workers). This extra cost strains a set of companies that in many ways are the source of growth in the economy—startups that nurture creative economic endeavors.
The ACA addressed this burden—incompletely—by offering tax credits to assist in the provision of health insurance for firms with 25 or fewer full-time employees, and a separate assistance still misses the reality of how loading fees work in the real world. The loading fee remains very high for firms that are well below the 100-worker cutoff. While SHOP is available to assist firms with 100 or fewer employees, this is true in only four states. The small group market, and thus the SHOP, is 50 employees and under everywhere else.
The employer mandate has a separate negative consequence that affects low-wage workers, particularly those working for small- to medium-sized firms near or at the minimum wage: It can cost them their jobs. If a firm is mandated to provide health insurance or pay a penalty (as the current ACA does for firms with more than 50 full-time employees including FTEs), they normally have the option of shifting the costs of that health insurance back to the worker in the form of lower wages, at least in the long run (e.g., by giving out small or no raises, or simply by reducing wage income immediately). But if the worker is at or near the prevailing minimum wage law, that option no longer exists, and to the extent that minimum wage laws increase over time (relative to median wages), they capture more and more workers in this net. For example, a recent study found between 28,000 and 50,000 businesses nationwide appear to be reducing their number of FTE employees to below 50 because of the mandate. This translates to roughly 250,000 positions eliminated from those businesses.[iv]
To assess the performance of the employer mandate to significantly finance the ACA at the tens of billions of revenue as predicted, we compared data from CBO’s projections and internal data provided by the IRS. We find a major disconnect between the CBO’s projections of penalty payments by employers and the actual collections ultimately made by the IRS.
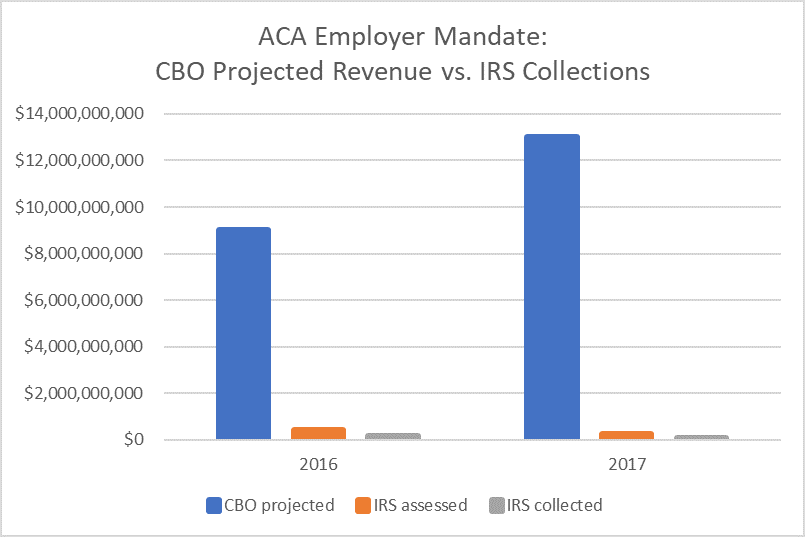
The March 2015 CBO baseline estimated $167 billion in net revenue from the employer mandate from 2016 to 2025. This baseline was released more than one year after the last major policy change (transitional relief to small employers for tax year 2015) prior to full implementation of the mandate in 2016. Looking at actual collections reported by IRS, we see that CBO was off by nearly two orders of magnitude. As seen in Figure 1, for 2016, the CBO projected $9 billion in revenue from the mandate penalty. In contrast, the IRS reported penalties of $420 million assessed for tax year 2016, and after dispute resolution, $142 million collected. While complete information is still not available from the IRS for tax year 2017, preliminary data indicates a similar gap. The March 2015 CBO baseline projected net revenue from employer penalty payments of $13 billion. As of June 2020, the IRS had assessed $264 million in penalties and collected only $66 million.
Furthermore, the cost of enforcement is not trivial. The IRS reports they have 114 full-time staff members working to enforce the penalty.
The disparity between the CBO projections and the amount IRS has collected is even more pronounced when considering the distinction between gross collections and net revenue. In its projections from March 2015, CBO specifies that the projection includes gross penalty collections and the associated effects of changes in taxable compensation on income and payroll tax revenues, which are included in the estimate of the tax exclusion for employment-based insurance. However, in the March 2016 baseline, CBO projects gross collections and explains that the 10-year estimate is 28 percent higher than the net revenue impact for the same period. While the IRS data on penalty collections is more comparable to gross collections, CBO did not make projected gross collections publicly available in March 2015. However, since factoring this information into the comparison would only increase the difference between projections and actual collections data, we believe it is appropriate to use Figure 1 to illustrate the magnitude of the difference.
Ten years after the passage of the ACA, the employer mandate has been found to underperform expectations from CBO and has provided for only a fraction of the revenues expected. Specifically, only approximately 1% of the proposed revenue from the employer mandate penalty has been collected by the IRS. Given the expense of the program and the negative economic effects outlined earlier, an end to the penalty would have great merit as a policy change.
[i] Karaca-Mandic P, Abraham J, Phelps CE, How Do Health Insurance Loading Fees Vary by Group Size? Implications for Healthcare Reform, International Journal of Health Care Finance and Economics 2011; 11(3):181–207.
[ii] Pauly MV, Health Reform without Side Effects: Making Markets Work for Individual Health Insurance, Stanford, CA, The Hoover Institution Press, 2010.
[iii] Phelps, CE, Parente, ST. The Economics of US Health Care Policy. London, UK, Routledge Press, 2017.
[iv] Mulligan, C. The Employer Penalty, Voluntary Compliance, and the Size Distribution of Firms: Evidence from a Survey of Small Businesses. NBER Working paper 24037, November, 2017.
